15 JavaScript Data Visualization Libraries in 2020


#1 D3.js
D3 is one of the most popular JS libraries not just for data visualization, but also animations, data analysis, geo, and data utilities. It uses HTML, SVG, and CSS. But it comes with its downsides. It has a steep learning curve and the documentation is outdated and confusing to navigate.
Much of the API exposes direct access to the DOM, which might clash a little with how modern frontend frameworks like React or Vue work.
There are ways to work around that, though. One involves so-called declarative data-driven documents (d4 in short), which suggests letting the framework manipulate the DOM and using D3 strictly for the data API.

#2 Recharts
A data viz library created for React users. Recharts uses D3 under the hood and exposes declarative components. It’s pretty light and renders SVG elements to create beautiful, interactive charts. It’s easy to use and the documentation is a blast.
Charts are customizable and the library itself provides some nice examples. It delivers great performance for static charts and includes built-in general chart tools like legend tooltips and labels. It can be laggy when dealing with multiple animated charts on the same page and large datasets, but it will work for most use cases.

#3 Victory
A set of modular charting components designed specifically for React and React Native.Victory does a good job providing fundamentals to create a chart.Things like axes customization, labels, passing in different data sets for a single graph are all pretty straightforward, and tweaking styles and behavior is easy and intuitive. It’s really effective and lets you build some nice-looking charts with minimal code. Definitely worth checking out for cross-platform apps.

#4 React-vis
It’s a simple visualization library created by Uber, which allows you to create all the usual types of charts: bar charts, tree maps, line, area, and more. Its API is quite simple and offers a lot of flexibility. It’s light and the animations are simple but fluid. It also allows you to write custom charts based on existing elements.

#5 V Charts
It’s a good all-round tool for creating common charts with simple data configuration. It is based on Vue2.x and echarts.

#6 Trading Vuejs
It’s an advanced, comprehensive charting system for traders.

#7 Chartkick
Chartkick is a great tool not only for Vue, it enables you to generate charts that are functional and aesthetic.

#8 Flexmonster
It’s a pivot table component for React Native. Great for visualizing business data.
#9 Webdatarocks
A JavaScript pivot table component well compatible with React and other frameworks. It’s great for data reporting with its aggregating, sorting and and filtering features. It’s free to use in your Web browser.
#10 ApexCharts
A rather neat library for SVG charts, comes with a Vue.js and React wrapper. Its charts look great on different devices, and the library allows for customization and comes with comprehensive documentation. It can be laggy with larger datasets, so make sure it’s exactly what you’re looking for.

#11. Chart.js
A very popular open-source library with more than 40k stars on GitHub. It’s lightweight and lets you build responsive chart using HTML5 Canvas elements. You can easily mix and match line and bar charts to combine different datasets, which is quite the awesome feature.

#12. Echarts
This library created by Baidu is super useful for JavaScript data visualizations intended for the Web. It’s well-documented in English and works great with big datasets. It also supports both SVG and Canvas rendering.
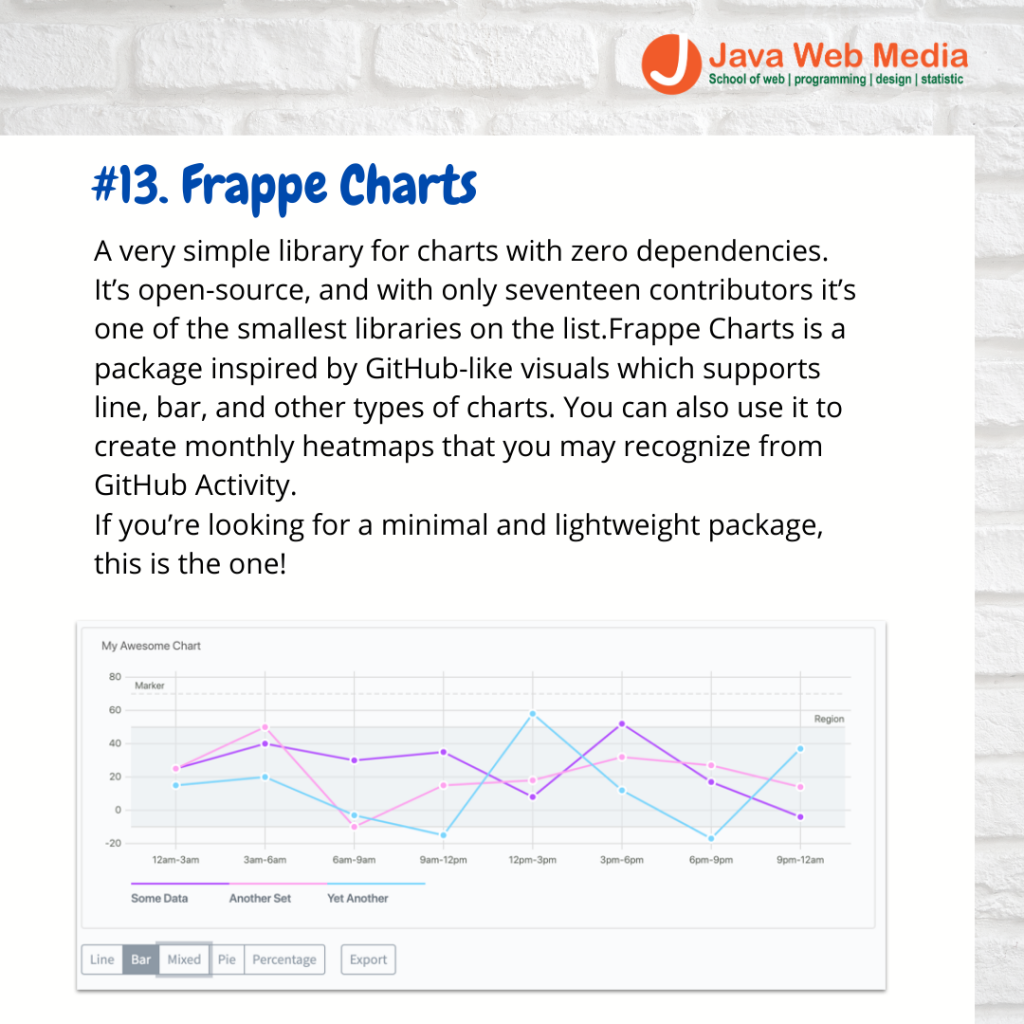
#13. Frappe Charts
A very simple library for charts with zero dependencies. It’s open-source, and with only seventeen contributors it’s one of the smallest libraries on the list.Frappe Charts is a package inspired by GitHub-like visuals which supports line, bar, and other types of charts. You can also use it to create monthly heatmaps that you may recognize from GitHub Activity. If you’re looking for a minimal and lightweight package, this is the one!

#14. Nivo
Nivo is a beautiful framework built on top of D3 and React, offering fourteen different types of components to present your data with. It was released in 2017, featured as product of the day on ProductHunt on August 20, 2017.
Nivo offers a lot of customization options and three rendering options: Canvas, SVG, and even API-based HTML. The documentation is exceptional and the demos are configurable and fun. It’s a high-level library and quite simple, but offers less potential for custom visualizations.

#15. Google Charts
An extremely popular Web service for charts that I simply couldn’t leave off the list. For many out there it’s the go-to JS library, as it provides multiple pre-built charts types, such as bar, line, area, calendar, geo charts, and many more.For me, however, the library feels like overkill in most cases and, frankly, I wouldn’t recommend using it.It’s free, but not open-source (pretty much like every Google product). It’s not responsive by default, but you can make it resize charts with some code.
Berita lainnya
Yuk baca berita Java Web Media
2.png)
PENGGUNAAN CHAT BOT AI (ARTIFICIAL INTELLEGENCE) DALAM PENGOLAHAN DATA PENELITIAN KUANTITATIF DAN KUALITATIF